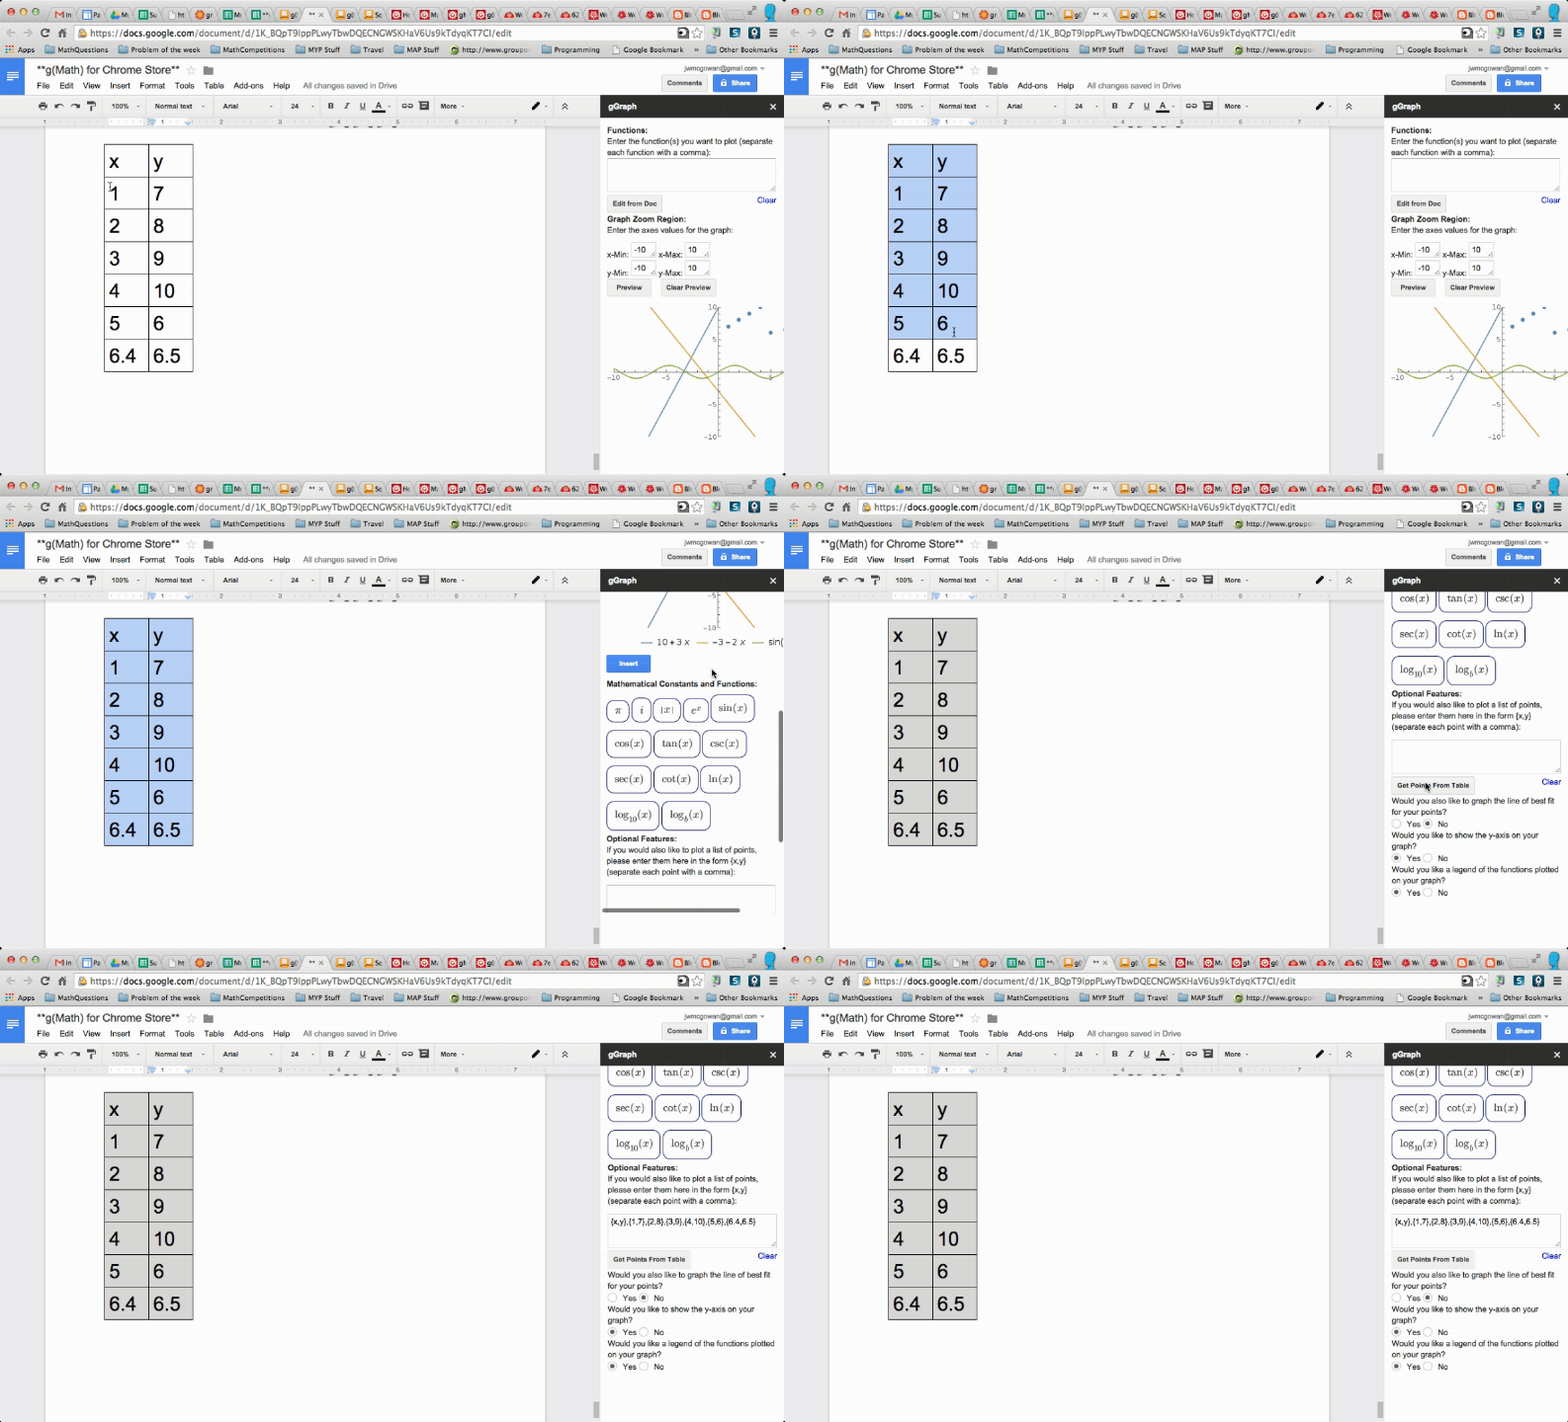
I am excited to announce the latest update of g(Math) now can plot data from a table in a Doc! All you need to do is select the table and then click on the Get Points from Table button. It will take the column on the left to be the x values and the column on the right to be the y values. Once the points are in the Sidebar, you can plot them with g(Math).
You can also do this in a Sheet by selecting a range of cells and then clicking Get Points from Selection.
You can also do this in a Sheet by selecting a range of cells and then clicking Get Points from Selection.
You can find more about this new addition on my new Help website: gmath.guru.

