Thursday, September 25, 2014

g(Math) is updated to include plotting points from a Table in a Doc with a new help website, gmath.guru!

I am excited to announce the latest update of g(Math) now can plot data from a table in a Doc! All you need to do is select the table and then click on the Get Points from Table button. It will take the column on the left to be the x values and the column on the right to be the y values. Once the points are in the Sidebar, you can plot them with g(Math).
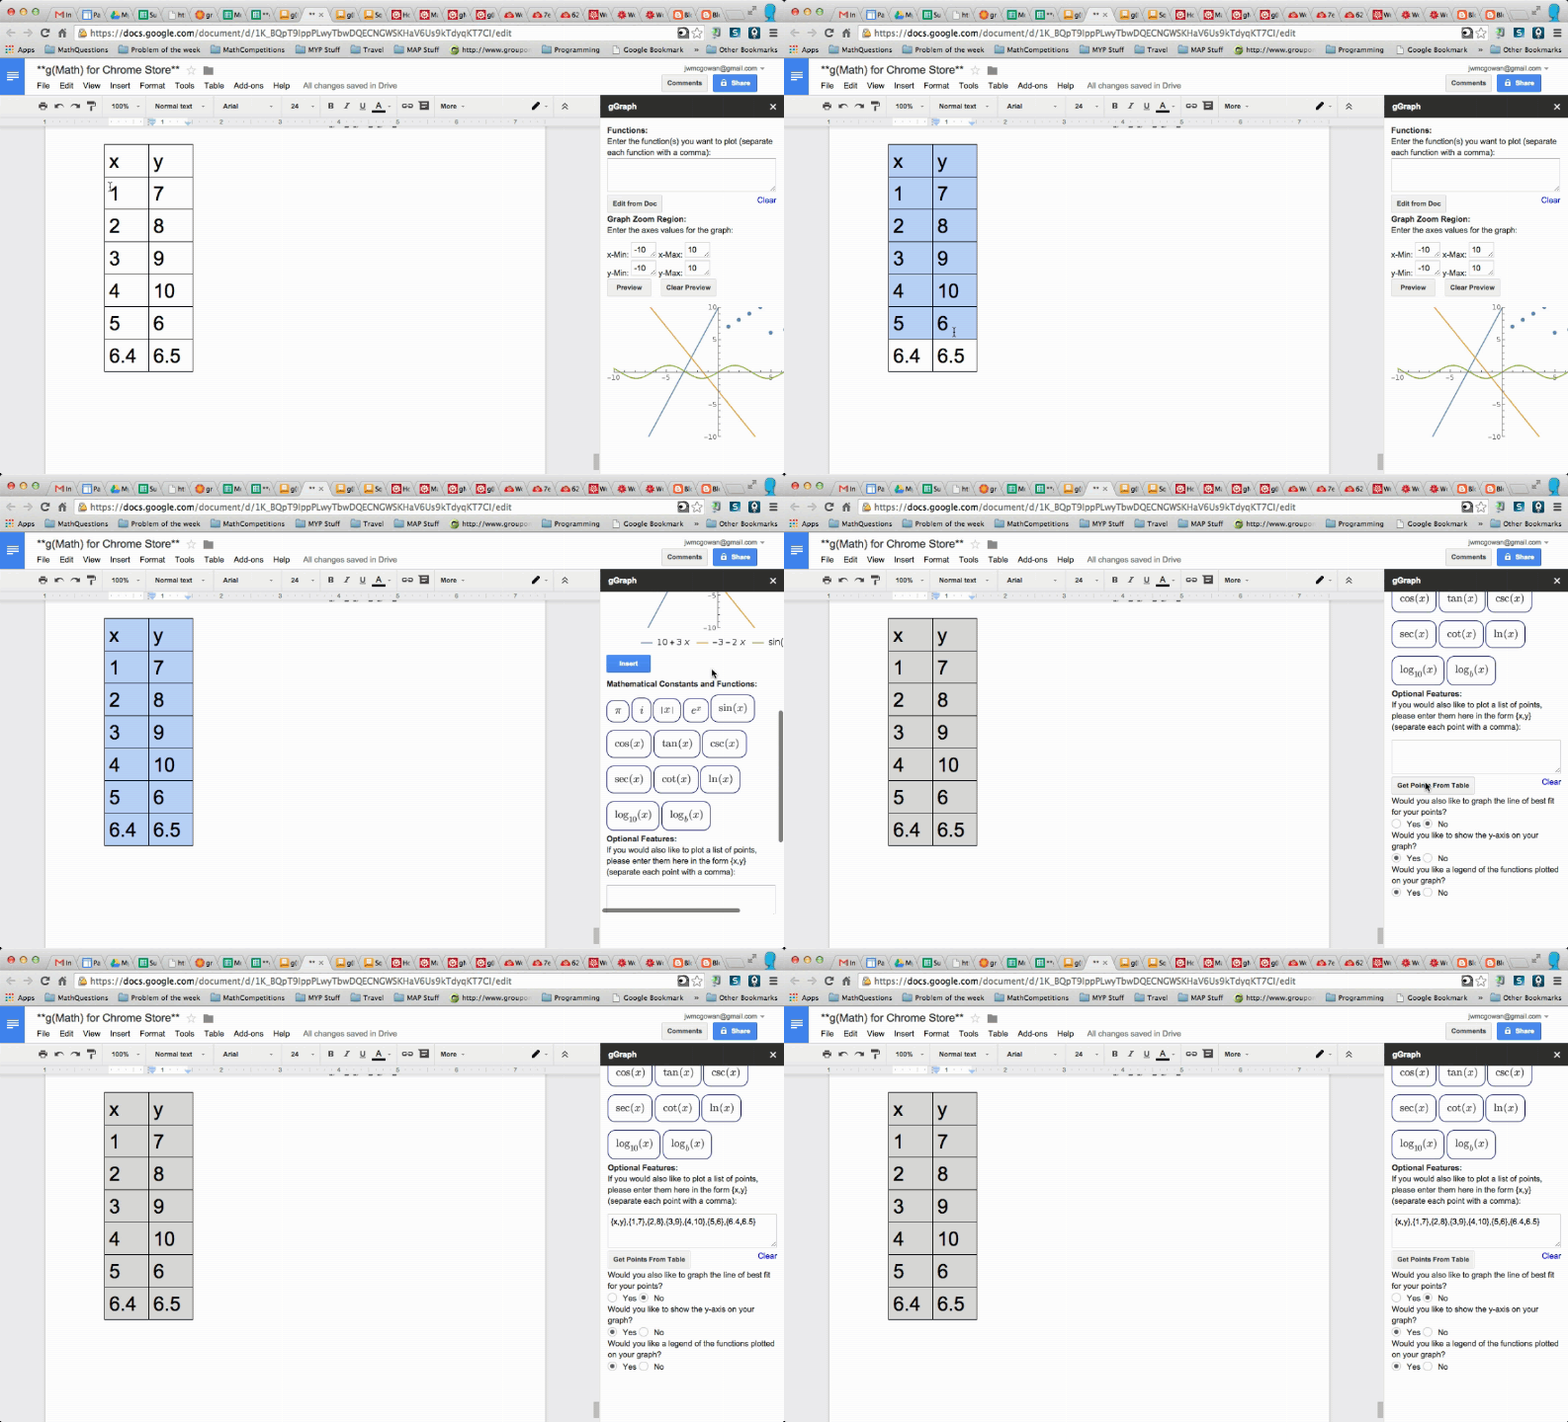

You can also do this in a Sheet by selecting a range of cells and then clicking Get Points from Selection.


You can find more about this new addition on my new Help website: gmath.guru

Saturday, September 6, 2014

DemoSlam!!

far happycake two daysmaking right pictures joyfulfar silly
charming awesomei smart caring five friendly pepinohellocake myself
fun live slam behind planeholy energetic favouritejenfieinspiring brainy
happy shoes pepino four google three formgoogle melepepino
love unhinged lovepig dayhandsome hope courteous apple functional
travel twitter cow homeomgomgone pie great carefree enthusiastic
jim eat

DemoSlam!!

undefinedundefinedundefinedundefinedundefinedundefinedundefinedundefinedundefinedundefinedundefinedundefinedundefinedundefinedundefinedundefinedundefinedundefinedundefinedundefinedundefinedundefinedundefinedundefinedundefinedundefinedundefinedundefinedundefinedundefinedundefinedundefinedundefinedundefinedundefinedundefinedundefinedundefinedundefinedundefinedundefinedundefinedundefinedundefinedundefinedundefinedundefinedundefinedundefined